Data updated as of 2022-23 P1 2/28/23
This dashboard provides details about student counts and funding amounts through the Supplemental Allocation, the Student Success Allocation and the Minimum Revenue Commitment/Funding Protections. The buttons on the left side of the page allow users to elevate data about statewide funding, funding for a specific district and funding for each of the metrics within the Supplemental and Student Success Allocations for each of the data years of the SCFF. Each page of the Dashboard has a text explanation for how to navigate the options on the page, an analysis of the data displayed and how it helps contextualize SCFF funding, and footnotes that contain details about the data and methodology.
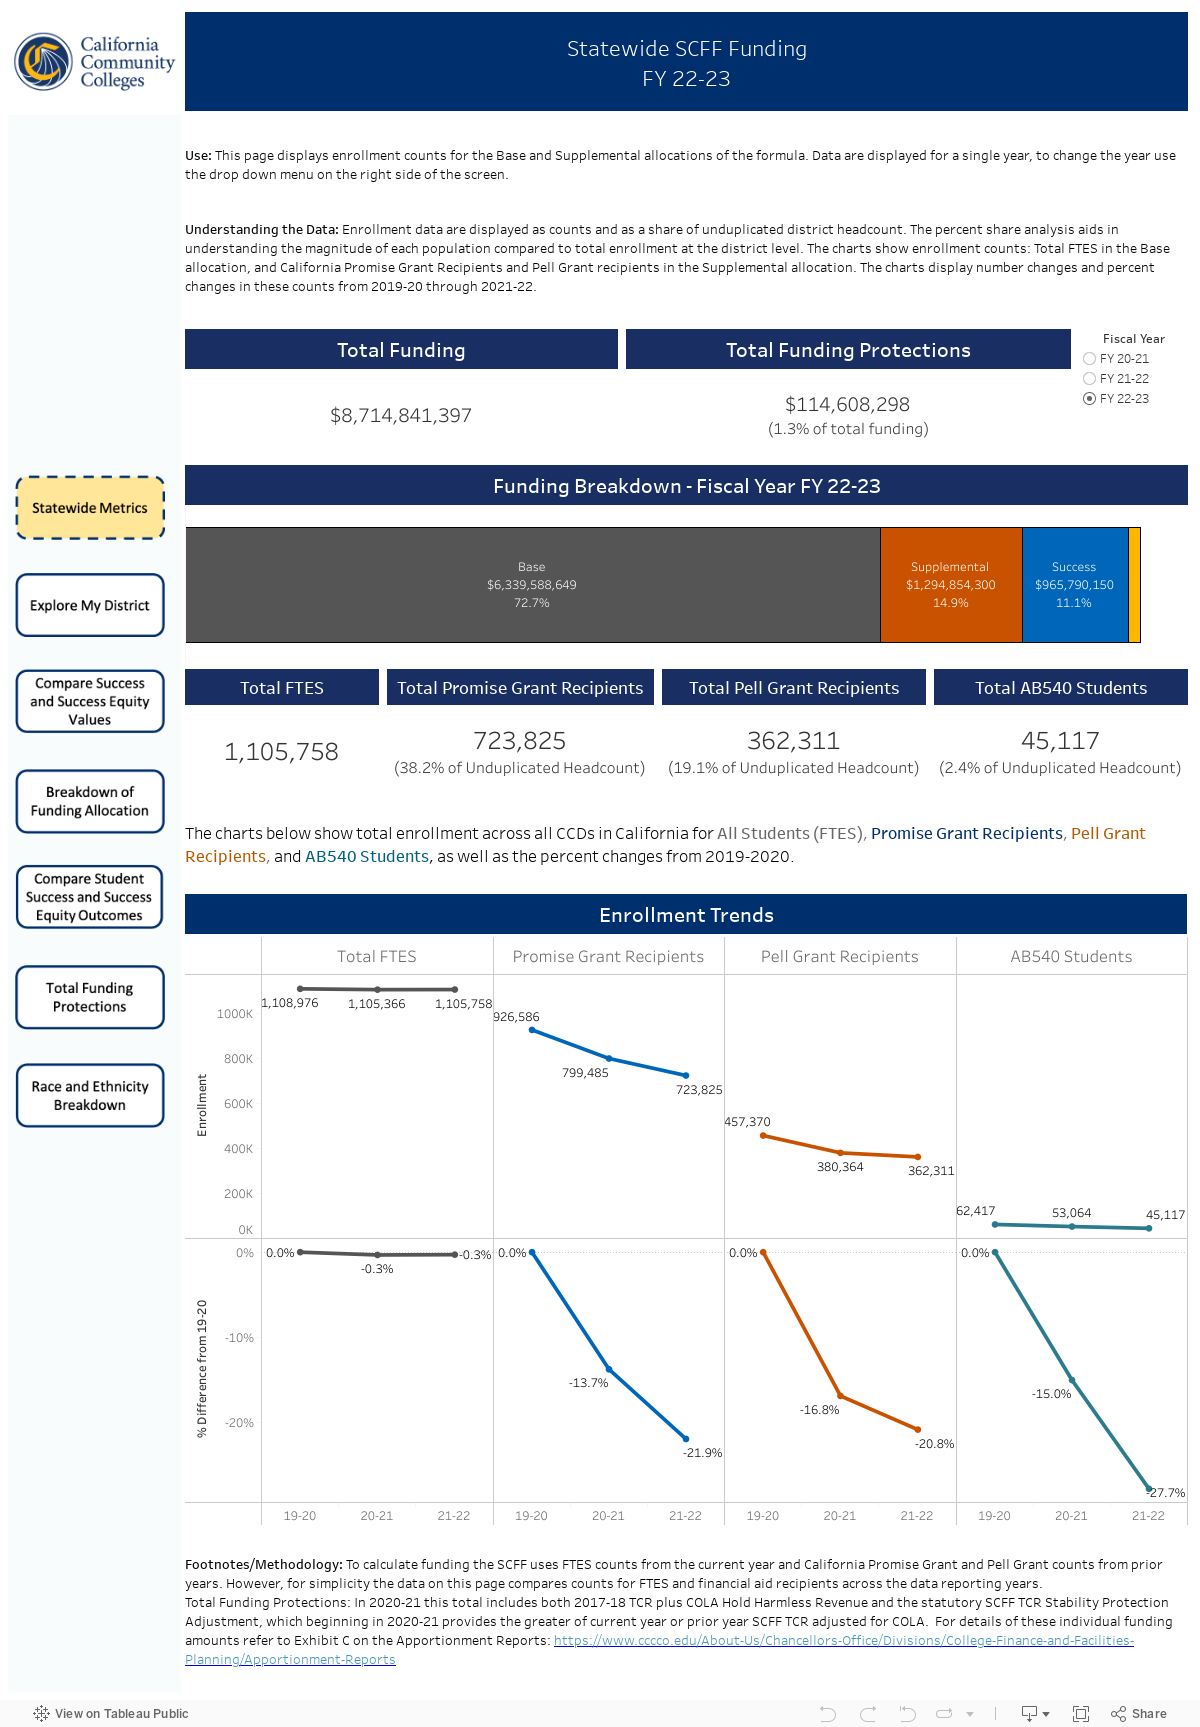
While funding calculations for the SCFF utilize three year averages in both the Base Allocation and Student Success Allocation the enrollment and outcome counts displayed in the following pages are single year numbers which allow districts to examine trends in enrollment and completions. For this reason, the numbers displayed on this portion of the Dashboard do not necessarily match the data displayed on Exhibit C of the Apportionment reports. Review dashboard key points (PDF) to learn more.